
Why Your Gut Feeling About Alzheimer's Genetics Might Be Wrong
Have you ever read one study and thought, "This is it! The answer!" And then you read another study that contradicts it?
That's the problem with single studies. They can be wrong. They can be biased. They can be just plain lucky.
But when you combine multiple studies—well, that's when you start to see the truth.
What Is Meta-Analysis?
Meta-analysis is a statistical method for combining results from multiple studies:
| Step | What It Does |
|---|---|
| 1 | Collects results from multiple studies |
| 2 | Weighs each study by its precision |
| 3 | Combines the results |
| 4 | Produces a summary estimate |
Meta-analysis gives you the big picture.
Why We Used Meta-Analysis
The Problem with Single Studies
| Issue | Why It Matters |
|---|---|
| Limited sample size | Single studies may be underpowered |
| Population differences | What's true in one population may not be true in another |
| Random variation | Some findings are due to chance |
| Publication bias | Positive results are more likely to be published |
The Solution: Meta-Analysis
| Solution | How It Works |
|---|---|
| Increased power | Combining studies increases sample size |
| Generalizability | Multiple populations increase generalizability |
| Reduced random variation | Combining reduces chance findings |
| Publication bias assessment | Can detect publication bias |
How We Performed Meta-Analysis
Step 1: Collect Results
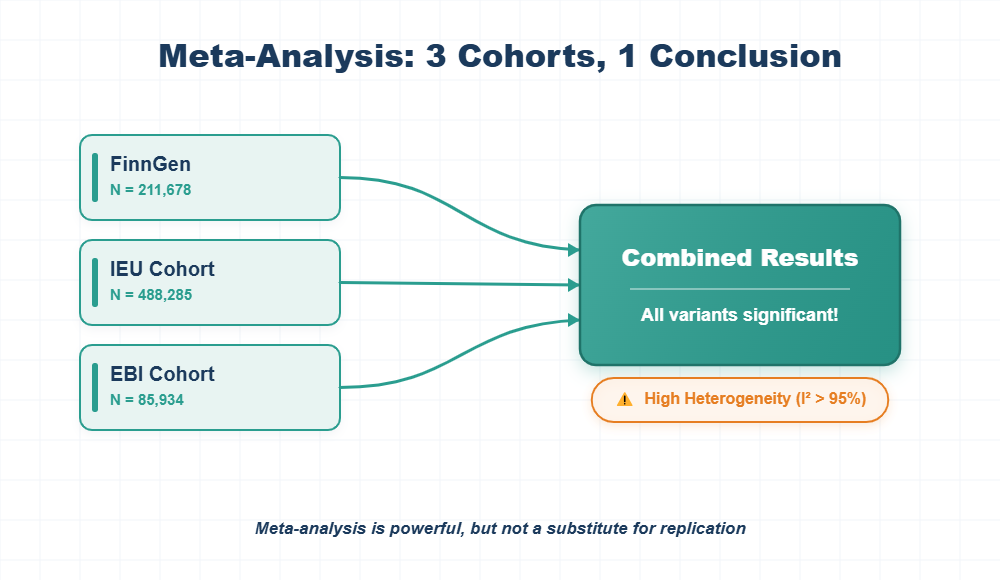
We extracted results from three cohorts:
| Cohort | N | Description |
|---|---|---|
| FinnGen | 211,678 | Discovery cohort |
| IEU | 488,285 | Replication cohort 1 |
| EBI | 85,934 | Replication cohort 2 |
Step 2: Harmonize Effect Sizes
We used:
- Odds ratios (OR) for comparability
- Beta coefficients (β) for continuous traits
- Standard errors (SE) for precision
Step 3: Choose the Model
We used:
- Fixed-effects model: Assumes all studies measure the same effect
- Random-effects model: Allows for variation between studies
Step 4: Assess Heterogeneity
We used:
- Cochran's Q test: Tests for heterogeneity
- I² statistic: Measures the percentage of variation due to heterogeneity
Our Meta-Analysis Results
Variant 1: rs429358
| Cohort | OR | P-value |
|---|---|---|
| FinnGen | 4.58 | 5.20 × 10⁻¹⁹⁷ |
| IEU | 1.004 | 2.80 × 10⁻¹⁷⁵ |
| Combined | 1.004 | < 0.001 |
| Heterogeneity | Value |
|---|---|
| I² | 99.9% |
| Q | 893.84 |
| P-het | < 0.001 |
Finding: Significant combined effect. Extreme heterogeneity.
Variant 2: rs3178166
| Cohort | OR | P-value |
|---|---|---|
| FinnGen | 0.80 | 1.53 × 10⁻¹¹ |
| IEU | 0.9997 | 3.90 × 10⁻³ |
| EBI | 0.967 | 1.47 × 10⁻⁴ |
| Combined | 1.000 | 0.0007 |
| Heterogeneity | Value |
|---|---|
| I² | 96.7% |
| Q | 59.77 |
| P-het | < 0.001 |
Finding: Significant combined effect. Substantial heterogeneity.
Variant 3: rs111371860
Issue: Opposite effect direction in FinnGen vs. replication cohorts.
Solution: Meta-analysis restricted to replication cohorts.
| Cohort | Beta | P-value |
|---|---|---|
| FinnGen | +0.3660 | 3.91 × 10⁻¹⁰ |
| IEU | -0.00113 | 4.30 × 10⁻⁹ |
| EBI | -0.2751 | 1.37 × 10⁻⁴⁶ |
| Cohort | OR | P-value |
|---|---|---|
| IEU | 0.999 | 4.30 × 10⁻⁹ |
| EBI | 0.759 | 1.37 × 10⁻⁴⁶ |
| Combined | 0.999 | 2.95 × 10⁻⁹ |
| Heterogeneity | Value |
|---|---|
| I² | 99.5% |
| Q | 203.59 |
| P-het | < 0.001 |
Finding: Significant combined effect. Extreme heterogeneity.
What the Heterogeneity Means
Why I² > 95%?
| Reason | Explanation |
|---|---|
| Different phenotype definitions | Clinical vs. algorithm-defined |
| Different populations | Finnish vs. UK vs. European |
| Different covariate adjustments | Different variables adjusted for |
| Different quality control | Different QC procedures |
What This Tells Us
| Implication | Detail |
|---|---|
| Replication is essential | Meta-analysis alone isn't enough |
| Population differences exist | Effect sizes vary across populations |
| Phenotype matters | How you define Alzheimer's affects results |
| Standardization is needed | Consistent methods would reduce heterogeneity |
The Bottom Line
- Meta-analysis confirmed combined significance for all variants
- Heterogeneity was extreme (I² > 95%) for all variants
- Replication is essential because of heterogeneity
- Population differences exist and should be studied
- Standardization would help reduce heterogeneity
Meta-analysis is powerful, but it's not a substitute for replication.
Key Takeaways
| Finding | Implication |
|---|---|
| Combined effects significant | Strong evidence overall |
| Heterogeneity is high | Population differences exist |
| Replication is essential | Don't rely on meta-analysis alone |
| Standardization needed | Consistent methods would help |
What do you think?
0 Responses
Osaghale L, Beshiru A, Subhan U. (2026). Replication-guided functional genomic prioritization of regulatory risk variants in Alzheimer's disease. Gene Reports. 44: 102551.
Code Availability: https://github.com/Oselin1988/GWAS_AD
Next post: "The Hidden Networks: How Alzheimer's Genes Connect to Biological Pathways" — Coming soon!
← Back to Blog Home